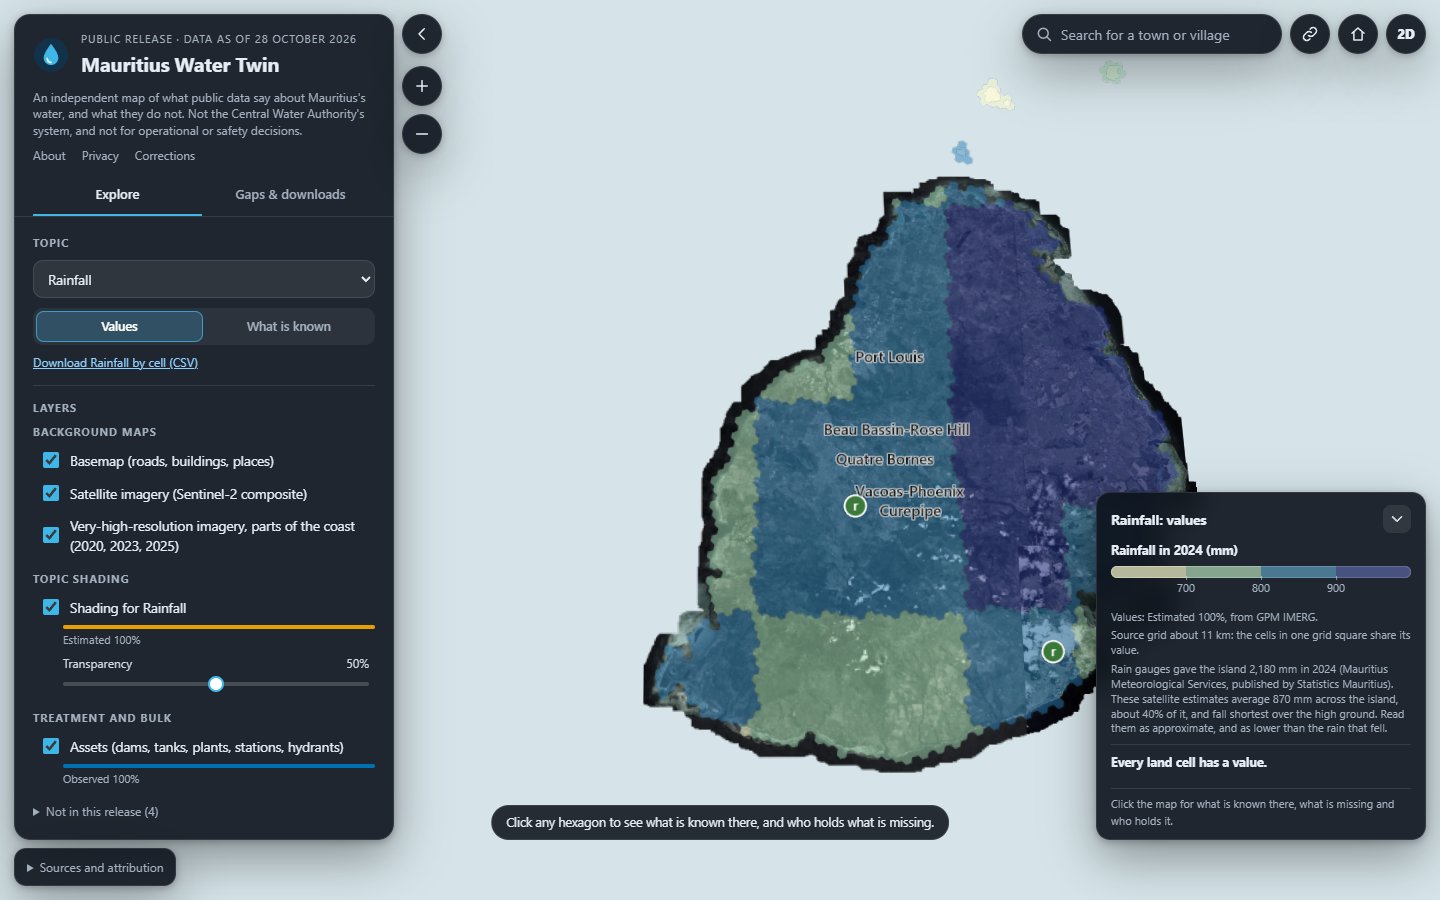
Mauritius publishes a good deal about its water, spread across statistical yearbooks, agency reports, satellite archives and open maps. What it lacks is one place where those facts sit side by side, each saying where it came from, how old it is and what kind of fact it is. The Mauritius Water Twin is that place: an independent map of the island, divided into hexagons, that shows what public data say about its water, and what they do not.
The twin is a separate application. On this page it stays a picture until you ask for it; Open the twin takes you to it full screen.
What the map shows
Twelve topics: terrain, land cover, rivers and streams, population, buildings, roads, rainfall, water mains, supply zones, service level, consumption and water quality. Each one shades the island cell by cell, over a basemap, a Sentinel-2 satellite composite and, along parts of the coast, very-high-resolution imagery from 2020, 2023 and 2025.
A search box finds any town or village. The view, the topic and the selected hexagon are kept in the address, so a shared link opens exactly what the sender was looking at.
Every value says what kind of fact it is
A number on a map invites more trust than it may deserve. In the twin, every value carries one of six labels, and names its source and its date.
Each topic’s legend reports how much of the island falls under each label: rainfall reads “Estimated 100%”, the layer of dams, tanks, plants, stations and hydrants “Observed 100%”.
What is missing is shown, not hidden
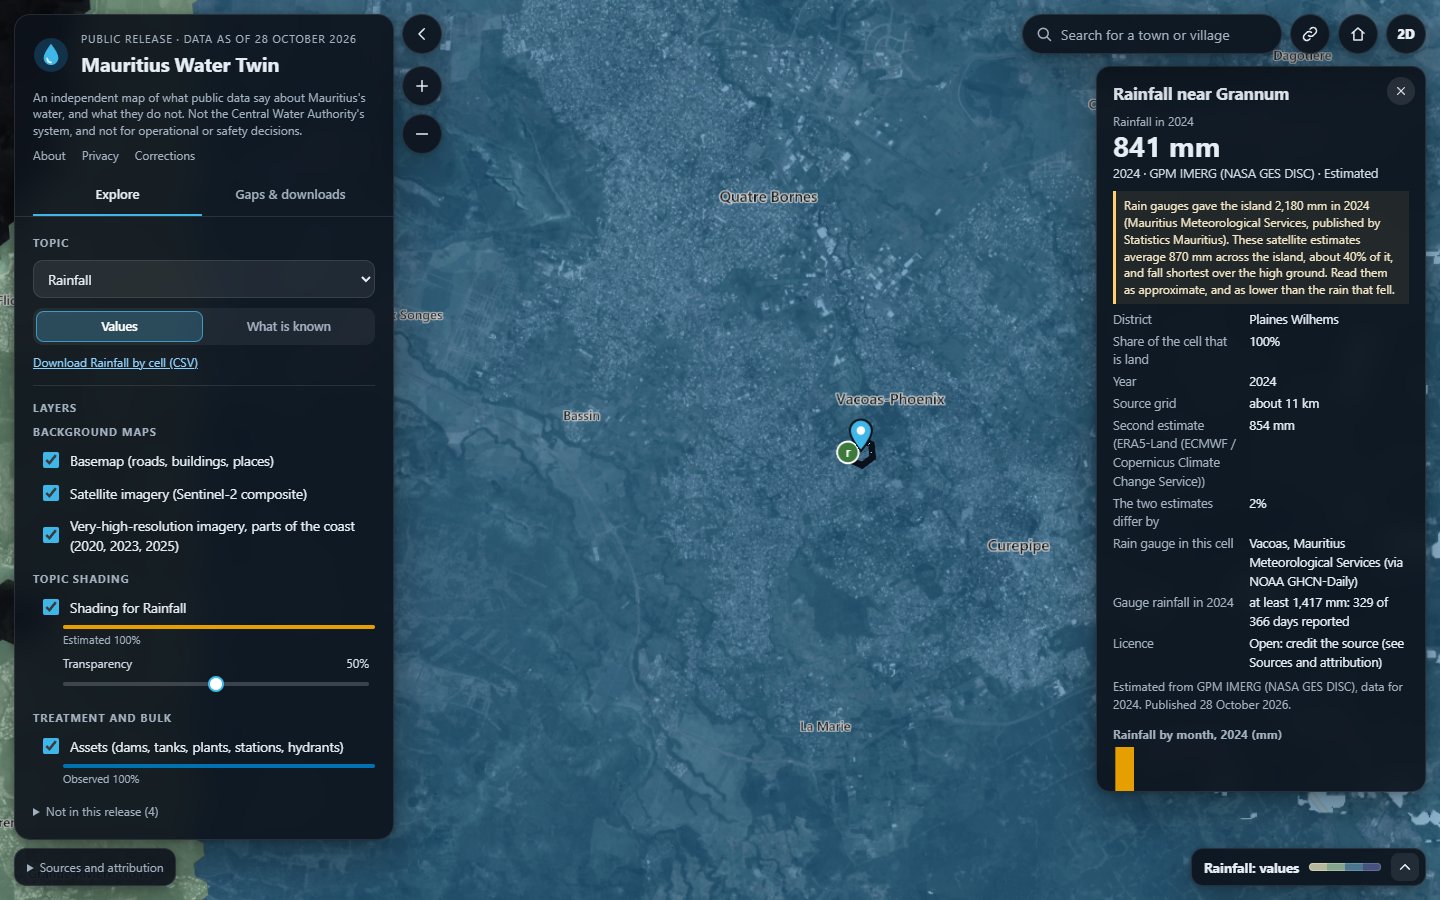
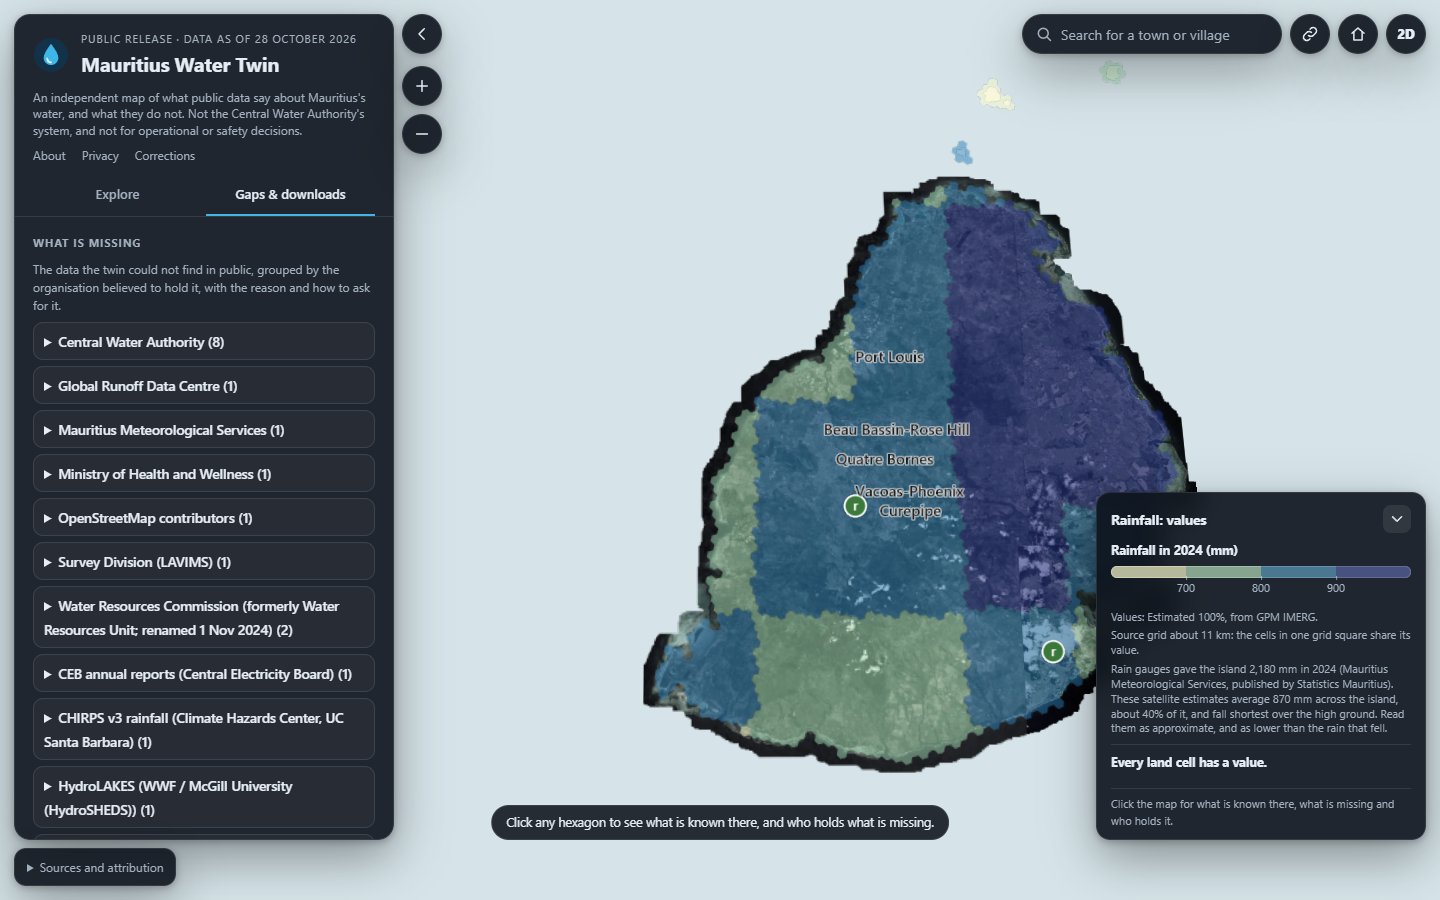
Clicking a hexagon shows what is known there and, for what is missing, who holds it and how it might be obtained. The Gaps and downloads tab gathers the missing data by the organisation believed to hold it, with the reason and how to ask for it, and offers that list and the data requests to download.
The wording is deliberately neutral. A dataset that has not been published is “not public”, nothing more. The twin records the gap; it does not assign blame.
Rain gauges and satellites, counted two ways
One finding shows why the labels matter.
In 2024 the island’s rain gauges measured 2,180 mm of rain (Mauritius Meteorological Services, published by Statistics Mauritius, Environment Statistics 2025). The satellite estimates the twin maps (GPM IMERG, NASA) average about 870 mm across the island, about 40 % of it.
At Vacoas, the gauge recorded at least 1,417 mm in 2024 (NOAA GHCN-Daily, 329 of 366 days reported), where the satellite gives 841 mm for its hexagon.
So rainfall on the map is labelled Estimated, not Observed, and its legend says to read the values as approximate and as lower than the rain that fell, falling shortest over the high ground. A map that showed the satellite figure without its label would look just as finished, and say something quite different.
How it is made
Public sources only. Every value names its source and its date, and the twin carries the full credits on its own Sources and attribution strip.
Dated, immutable editions. The twin is released as editions that do not change once published. The current one is the release of 28 October 2026; a new edition is added beside it rather than over it.
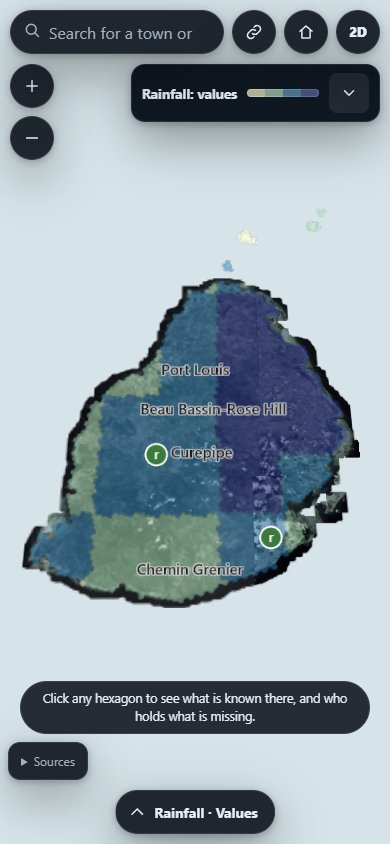
Static and private. It runs from plain files, on a desktop or a phone, sets no cookies and loads nothing from third parties.
Independent. The twin is not the Central Water Authority’s system and is not endorsed by it, by the Government of Mauritius or by any data holder. It is not for operational or safety decisions.
About, privacy and corrections
The twin’s own About, Privacy and Corrections pages sit in its header, one click from the map. Corrections to the data go through its Corrections page; for anything else, use our contact page.