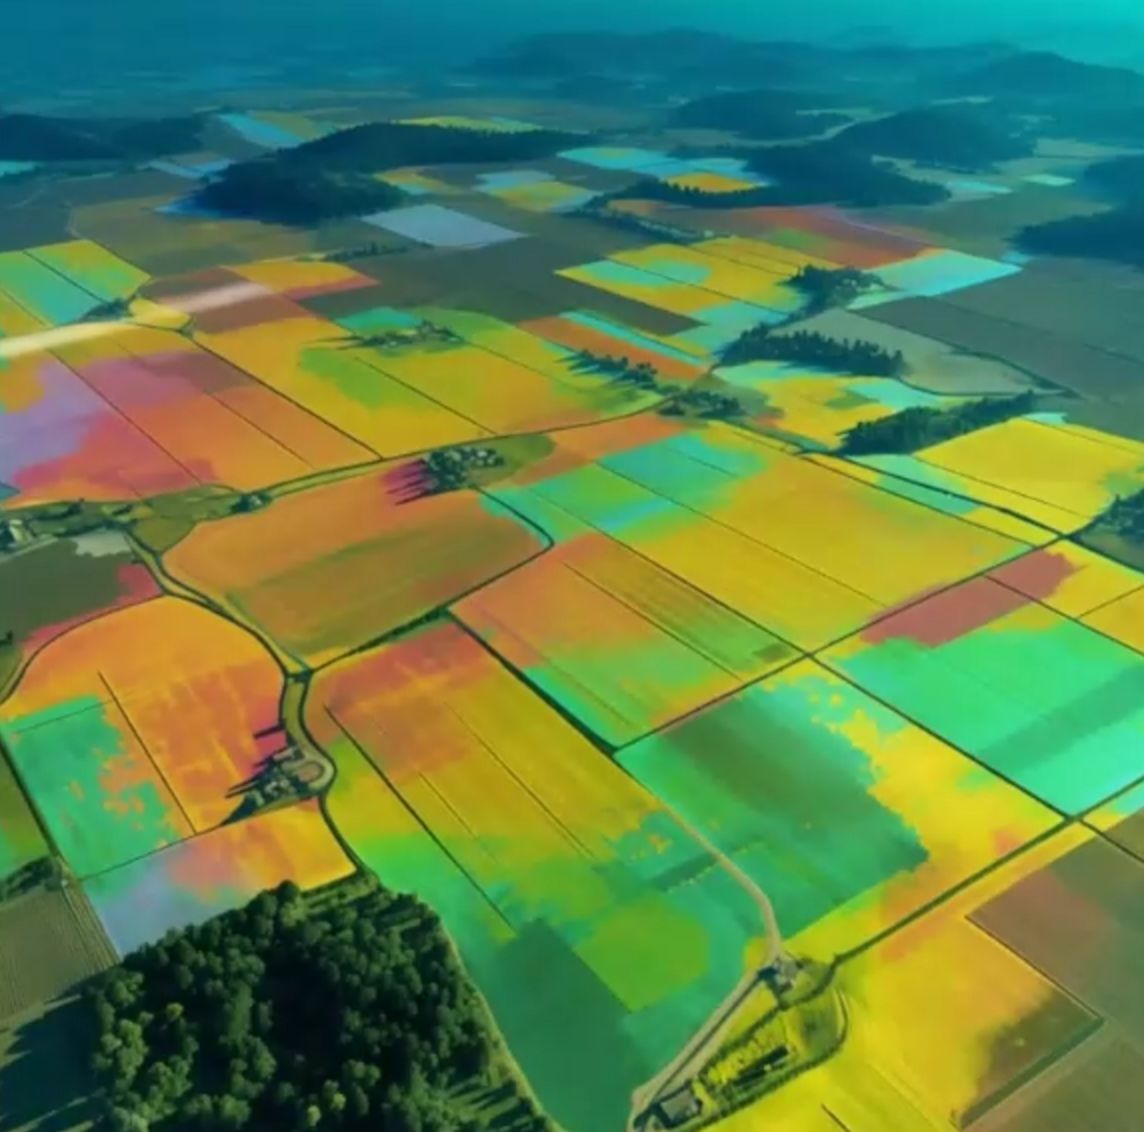
The European Union publishes some of the most detailed open data in the world on what grows where. The Copernicus High-Resolution Layer Crop Types maps crops across the Union at 10 m, year by year from 2017 to 2023. DG AGRI and the JRC turned it into a story map on crop diversity. We rebuilt that story as a 3D globe, and then took it further down, from satellite pixels to individual fields.
The globe is above. It is a separate application, so nothing loads until you launch it. The links marked with a globe in this article fly it to the chapter being discussed.
Open data is not the same as usable data
Open data usually arrives as rasters, classification codes and statistical boundaries, and almost none of it is readable by someone who is not a specialist. Turning it into something a farmer, a policy officer or a student can explore takes three things: a question worth asking, a place to start, and a way to move between scales without getting lost.
The globe organises the data as 14 story chapters, from the continent down to single municipalities, across 1,155 NUTS3 regions and 101,150 municipalities (LAU). An Explore mode adds search, and any view can be shared as a link, so a conversation about one valley can start from the same picture.
Show on the globe: mapping crops from space
Diversity as one number
The lens throughout is the effective number of crop types in an area: the exponential of Shannon diversity. It reads intuitively. An area planted with four crops in equal shares scores four. If one crop takes most of the land, the score falls towards one, however many minor crops are also present. That makes regions of very different size and farming systems comparable on a single scale.
At regional level the patterns are clear enough to read at a glance: where diversity is high, where it is low, and where a single crop shapes a whole landscape, such as the rice fields of Lombardy.
Regional patternsHigh diversityLow diversityLombardy’s rice fields
Why going below 10 m matters
A 10 m pixel covers 100 square metres. That is fine for large, uniform fields and much less so for small plots, mixed edges and the hedgerows and tree lines between them. Regional averages can hide exactly the fine-grained structure that diversity is about.
So for 26 EU regions the globe goes below the satellite layer, to the field parcels that farmers declare in their CAP aid applications (GSA/LPIS). These are published as open data in the fiboa collections on Source Cooperative. The parcels are mapped to the same crop classes as Copernicus with JRC’s EuroCrops table, so the two sources can be compared class for class.
Underneath sit the images that let a reader check what the data says: national orthophotos at 8 to 40 cm, the EU-wide Copernicus 2 m very-high-resolution mosaics for 2018 and 2021, dated Esri Wayback releases from 2017 to 2026, and the Copernicus Small Woody Features layer at 5 m.
Show on the globe: down to individual fields
Écija, counted two ways
Écija, in the province of Sevilla, shows what the two sources say side by side. For the whole municipality, the 2025 declared parcels give 6.5 effective crop types. Copernicus, for 2023, gives 7.6. Olive groves are the largest class in both.
The comparison is indicative, not a verdict on either source. Declared crops are what farmers report in their aid applications. Copernicus crops are classified from satellite imagery. The two figures also describe different years. Both put olive groves first, and the gap between them is a prompt to look closer, which is what the imagery layers are there for.
Built to cost the reader as little as possible
The globe runs from plain static files, with no server behind it. Map tiles are read from a single archive using HTTP range requests, so the browser fetches only the pieces it needs, and they are drawn in background workers to keep the page responsive. A returning visitor downloads about 104 KB instead of 14.5 MB, measured with headless Chrome against a local test server.
This page follows the same principle: the globe stays a poster until you ask for it. The same discipline applies to any data product. The data platform underneath decides what is possible, and the interface on top decides whether anyone uses it.
Show on the globe: conclusions
Data and credits
Copernicus Land Monitoring Service (EEA), including the High-Resolution Layer Crop Types, the very-high-resolution mosaics and Small Woody Features. The DG AGRI & JRC story map on EU crop diversity. JRC EuroCrops. The fiboa field-parcel collections on Source Cooperative and their national providers. The globe’s own “Data & credits” tab lists every source and licence.