In September 2026 the central equatorial Pacific ran 2.1 °C above normal, and NOAA now gives an 83 % chance that this El Niño will be the strongest since records began in 1950. It arrives in an ocean that the tenth Copernicus Ocean State Report, published this year in State Planet, describes in 19 peer-reviewed chapters, from the Arctic to the harbours of Spain. We turned that report into a 3D globe that can be read like a story, and opened it on the Pacific as it is now.
Why this report matters now
The globe is above. It is a separate application, so nothing loads until you launch it. The links marked with a globe in this article fly it to the chapter being discussed.
El Niño moves heat and rain around the planet, and its costs fall hardest where it is already hot. Researchers at the University of Chicago's Climate Impact Lab project about 451,000 additional heat-related deaths between September 2026 and February 2027, around 66,800 of them across the Sahel and about 17,600 in Sudan, where a humanitarian crisis is already under way. The estimate counts heat alone, not drought, fire or flood. None of this is in the Ocean State Report, which was written before the event, but the report describes what the event lands on: an ocean whose surface has just had its three warmest years on record, small island states exposed to rising heat, and seas where heat lingers below the surface.
Show on the globe: the Pacific now
Ocean reports are written for specialists. Their findings arrive as trend maps, percentiles and return periods, each with its own baseline, and the place that matters is often a single bay or tide gauge. A reader who does not already know where the Bothnian Bay is, or why a fresher Barents Sea matters for the deep ocean, has little to hold on to.
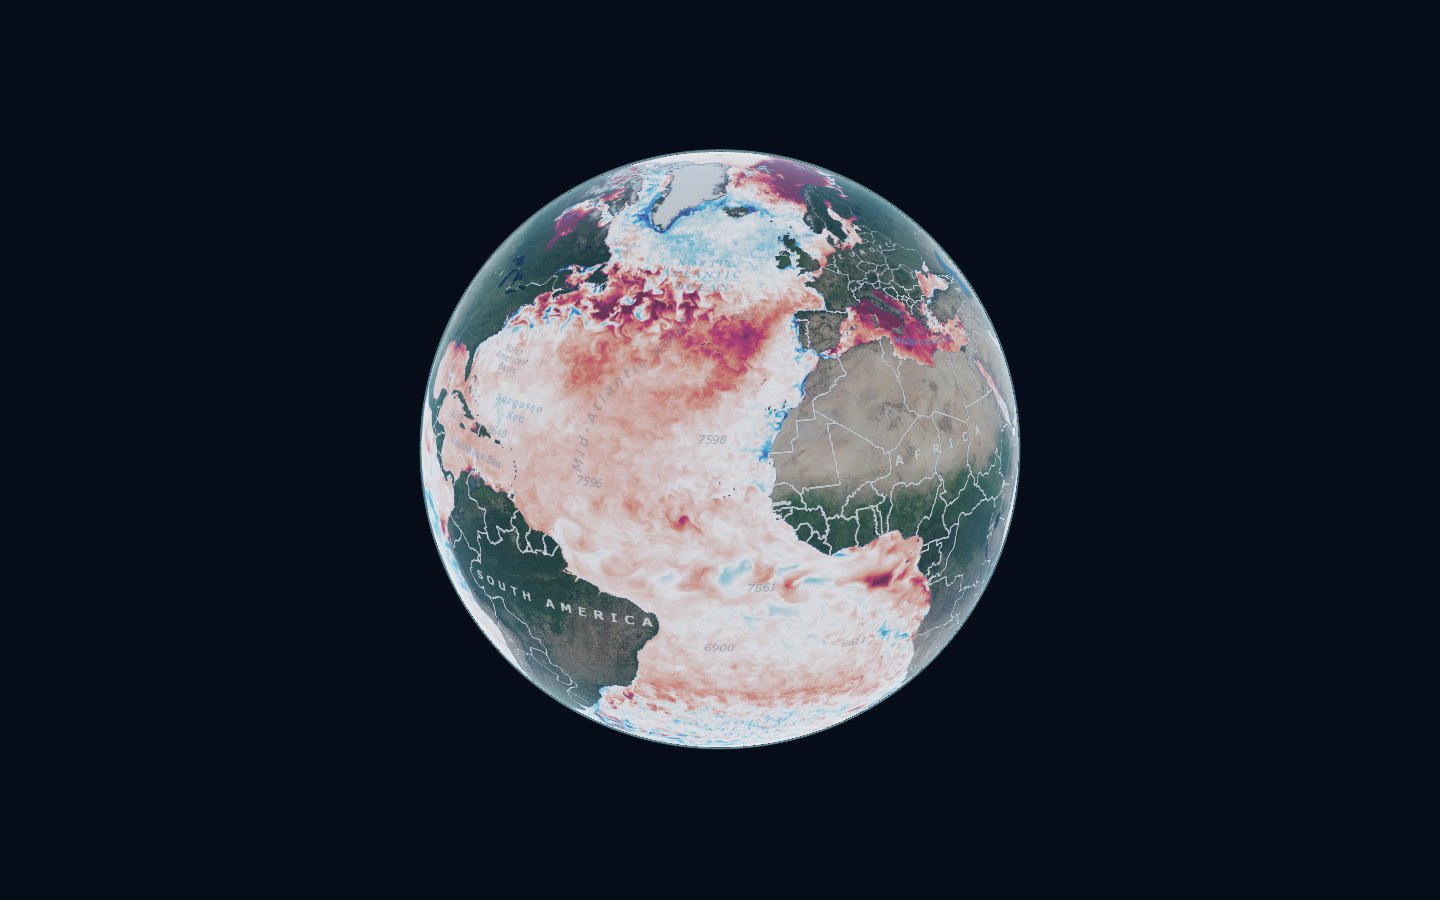
After its opening look at the Pacific, the globe follows the report in 18 stops. Each one flies to the region in question, draws the ocean variable that the chapter is about for the dates it discusses, and sets the chapter's key numbers beside it, each with its source section. The report's own figures sit one click away.
Show on the globe: the overview
Live data, not pictures of data
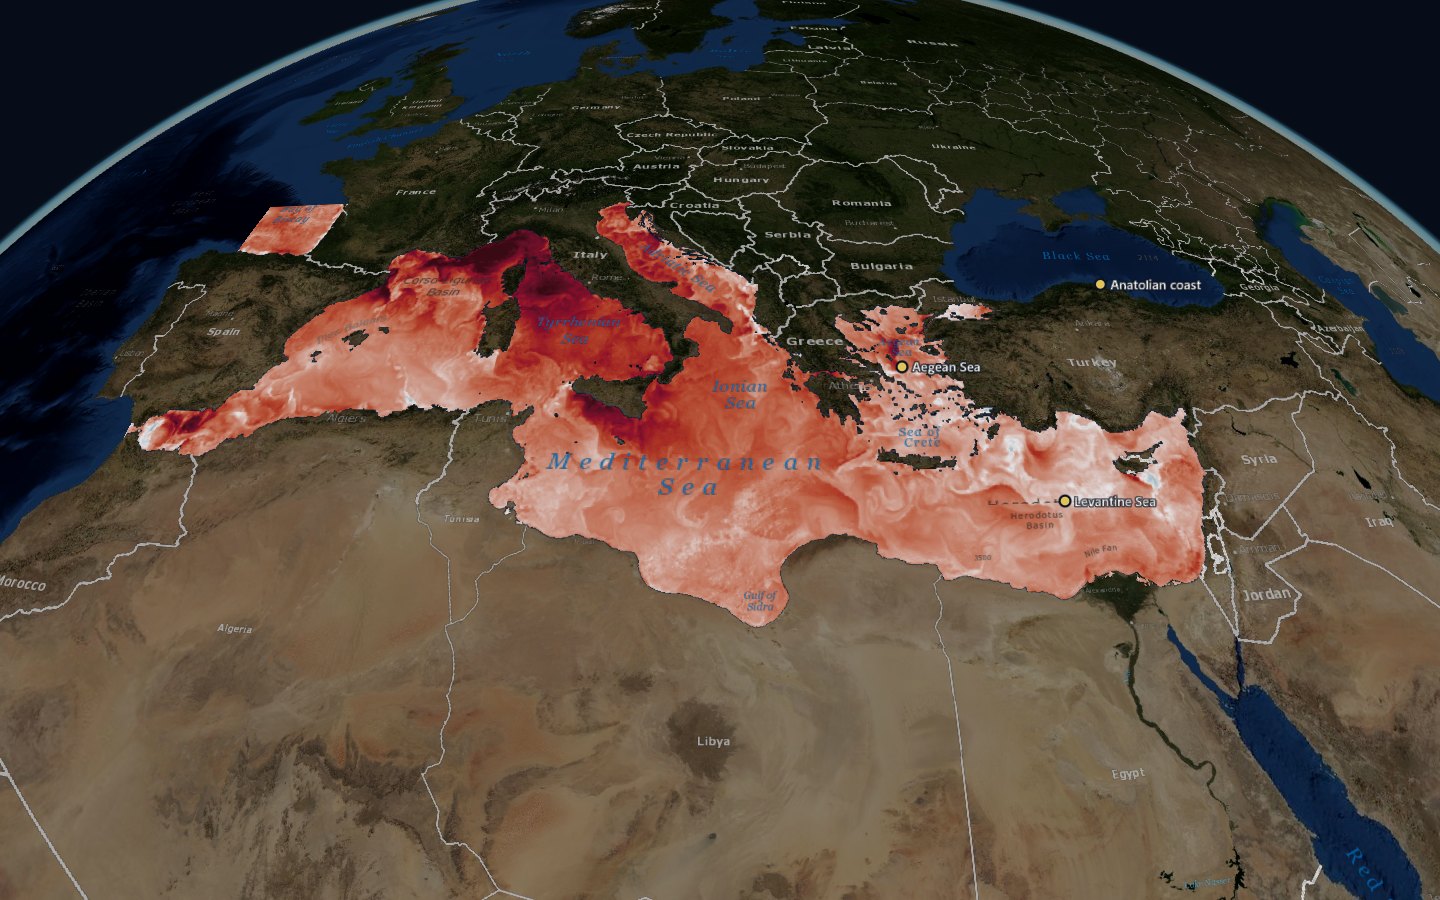
Nothing on the globe is a screenshot. The maps are requested from the public map service of the Copernicus Marine Service as you move, for the exact day, month or hour in question: sea-ice concentration through the 2024 Arctic melt season, sea surface temperature anomalies through the Mediterranean summer, three-hourly wave heights through a winter storm. Click the ocean and the globe asks the same service for the value at that point.
That matters for trust. A reader can step a day forward or back, open any date in a product's record in the Explore tab, and share the exact view as a link. The legend names the product behind every map. Where the map is a model rather than an observation, it says so, and where a chapter offers a long-term trend as well as a dated snapshot, the reader can switch between the two.
The Arctic melt seasonThe Mediterranean in 2024Is sea-level rise speeding up?
2024, month by month
Part of the report reads like a calendar. In February, Storm Louis drove waves of more than 8 m off Galicia, yet the strongest harbour agitation came at Tarragona on the Mediterranean, where waves of only about 1.7 m arrived from the south, straight into the harbour mouth. Across the year the average spot in the Mediterranean spent 214 days in marine heatwave conditions, measured against a fixed 1982 to 2011 baseline. In October the Po's discharge reached 7,880 cubic metres a second, a record in the daily data one chapter analyses. In November a storm drove water out of the Bothnian Bay, and the tide gauge at Kemi fell to a record minus 153 cm.
On the globe each of these can be played through. The Bothnian Bay chapter steps through 19 to 23 November 2024 in three-hour frames from the Copernicus Baltic forecast model, so the water can be seen leaving the bay and piling up at the eastern end of the Gulf of Finland.
Storm LouisThe Adriatic riversThe Bothnian Bay
The numbers depend on how you count
The report is candid about method, and the globe tries to carry that through. Counted against a fixed baseline, 2024 gave the Mediterranean an average of 214 heatwave days. Against a moving baseline it gave 145, and with the warming trend removed, 63. Each answer is right for a different question. In the Gironde estuary, satellite water clarity appears to fall by 2.6 cm a year, but once observational uncertainty is included, only 32.8 % of 5,000 simulations still show a significant decline.
So every number on the globe names its section of the report, and numbers that the report cites from other studies say so. Where the report gives two different values for the same quantity, as it does for the 50-year wave height at an Estonian gas terminal, the globe shows neither and explains why.
Show on the globe: the synthesis
Built to cost the reader as little as possible
The globe is a static application with no server behind it and no keys. The Copernicus map service sends its images straight to the browser, the story, the report index and the indicator charts load as a few small files, and the application is kept on the reader's device after the first visit. Copernicus renames its datasets from time to time, so a small check confirms that every one of the 24 layers still answers.
This page follows the same principle: the globe stays a poster until you ask for it. The same discipline applies to any data product. The data platform underneath decides what is possible, and the interface on top decides whether anyone uses it.
Data and credits
von Schuckmann, K., Grégoire, M., Brasseur, P., Garric, G., Karstensen, J., Lionello, P., Marcos, M., Poulain, P.-M., and Staneva, J. (Eds.): 10th edition of the Copernicus Ocean State Report (OSR10), State Planet, 7-osr10, 2026 (CC BY 4.0). Map layers and indicator series: E.U. Copernicus Marine Service Information. El Niño figures: NOAA Climate Prediction Center, ENSO diagnostic discussion of 8 October 2026; University of Chicago Climate Impact Lab, El Niño heat-mortality projection, September 2026. Base map: NASA Blue Marble via GIBS; place names: Esri. The globe’s own Data tab lists every product and licence.